Regression to the mean is a common statistical phenomenon that can mislead us when we observe the world. Learning to recognize when regression to the mean is at play can help us avoid misinterpreting data and seeing patterns that don’t exist.
***
It is important to minimize instances of bad judgment and address the weak spots in our reasoning. Learning about regression to the mean can help us.
Nobel prize-winning psychologist Daniel Kahneman wrote a book about biases that cloud our reasoning and distort our perception of reality. It turns out there is a whole set of logical errors that we commit because our intuition and brains do not deal well with simple statistics. One of the errors that he examines in Thinking Fast and Slow is the infamous regression toward the mean.
The notion of regression to the mean was first worked out by Sir Francis Galton. The rule goes that, in any series with complex phenomena that are dependent on many variables, where chance is involved, extreme outcomes tend to be followed by more moderate ones.
In Seeking Wisdom, Peter Bevelin offers the example of John, who was dissatisfied with the performance of new employees so he put them into a skill-enhancing program where he measured the employees’ skill:
Their scores are now higher than they were on the first test. John’s conclusion: “The skill-enhancing program caused the improvement in skill.” This isn’t necessarily true. Their higher scores could be the result of regression to the mean. Since these individuals were measured as being on the low end of the scale of skill, they would have shown an improvement even if they hadn’t taken the skill-enhancing program. And there could be many reasons for their earlier performance — stress, fatigue, sickness, distraction, etc. Their true ability perhaps hasn’t changed.
Our performance always varies around some average true performance. Extreme performance tends to get less extreme the next time. Why? Testing measurements can never be exact. All measurements are made up of one true part and one random error part. When the measurements are extreme, they are likely to be partly caused by chance. Chance is likely to contribute less on the second time we measure performance.
If we switch from one way of doing something to another merely because we are unsuccessful, it’s very likely that we do better the next time even if the new way of doing something is equal or worse.
This is one of the reasons it’s dangerous to extrapolate from small sample sizes, as the data might not be representative of the distribution. It’s also why James March argues that the longer someone stays in their job, “the less the probable difference between the observed record of performance and actual ability.” Anything can happen in the short run, especially in any effort that involves a combination of skill and luck. (The ratio of skill to luck also impacts regression to the mean.)
“Regression to the mean is not a natural law. Merely a statistical tendency. And it may take a long time before it happens.”
— Peter Bevelin
Regression to the Mean
The effects of regression to the mean can frequently be observed in sports, where the effect causes plenty of unjustified speculations.
In Thinking Fast and Slow, Kahneman recalls watching men’s ski jump, a discipline where the final score is a combination of two separate jumps. Aware of the regression to the mean, Kahneman was startled to hear the commentator’s predictions about the second jump. He writes:
Norway had a great first jump; he will be tense, hoping to protect his lead and will probably do worse” or “Sweden had a bad first jump and now he knows he has nothing to lose and will be relaxed, which should help him do better.
Kahneman points out that the commentator had noticed the regression to the mean and come up with a story for which there was no causal evidence (see narrative fallacy). This is not to say that his story could not be true. Maybe, if we measured the heart rates before each jump, we would see that they are more relaxed if the first jump was bad. However, that’s not the point. The point is, regression to the mean happens when luck plays a role, as it did in the outcome of the first jump.
The lesson from sports applies to any activity where chance plays a role. We often attach explanations of our influence over a particular process to the progress or lack of it.
In reality, the science of performance is complex, situation dependent and often much of what we think is within our control is truly random.
In the case of ski jumps, a strong wind against the jumper will lead to even the best athlete showing mediocre results. Similarly, a strong wind and ski conditions in favor of a mediocre jumper may lead to a considerable, but a temporary bump in his results. These effects, however, will disappear once the conditions change and the results will regress back to normal.
This can have serious implications for coaching and performance tracking. The rules of regression suggest that when evaluating performance or hiring, we must rely on track records more than outcomes of specific situations. Otherwise, we are prone to be disappointed.
When Kahneman was giving a lecture to Israeli Air Force about the psychology of effective training, one of the officers shared his experience that extending praise to his subordinates led to worse performance, whereas scolding led to an improvement in subsequent efforts. As a consequence, he had grown to be generous with negative feedback and had become rather wary of giving too much praise.
Kahneman immediately spotted that it was regression to the mean at work. He illustrated the misconception by a simple exercise you may want to try yourself. He drew a circle on a blackboard and then asked the officers one by one to throw a piece of chalk at the center of the circle with their backs facing the blackboard. He then repeated the experiment and recorded each officer’s performance in the first and second trial.
Naturally, those that did incredibly well on the first try tended to do worse on their second try and vice versa. The fallacy immediately became clear: the change in performance occurs naturally. That again is not to say that feedback does not matter at all – maybe it does, but the officer had no evidence to conclude it did.
The Imperfect Correlation and Chance
At this point, you might be wondering why the regression to the mean happens and how we can make sure we are aware of it when it occurs.
In order to understand regression to the mean, we must first understand correlation.
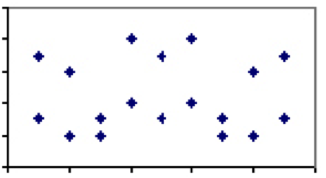
The correlation coefficient between two measures which varies between -1 and 1, is a measure of the relative weight of the factors they share. For example, two phenomena with few factors shared, such as bottled water consumption versus suicide rate, should have a correlation coefficient of close to 0. That is to say, if we looked at all countries in the world and plotted suicide rates of a specific year against per capita consumption of bottled water, the plot would show no pattern at all.
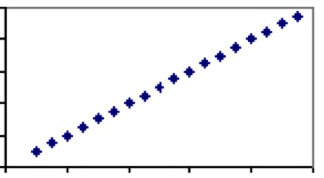
On the contrary, there are measures which are solely dependent on the same factor. A good example of this is temperature. The only factor determining temperature – velocity of molecules — is shared by all scales, hence each degree in Celsius will have exactly one corresponding value in Fahrenheit. Therefore temperature in Celsius and Fahrenheit will have a correlation coefficient of 1 and the plot will be a straight line.
There are few if any phenomena in human sciences that have a correlation coefficient of 1. There are, however, plenty where the association is weak to moderate and there is some explanatory power between the two phenomena. Consider the correlation between height and weight, which would land somewhere between 0 and 1. While virtually every three-year-old will be lighter and shorter than every grown man, not all grown men or three-year-olds of the same height will weigh the same.
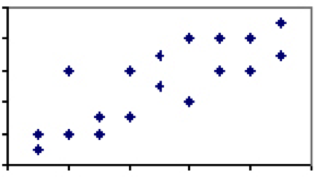
This variation and the corresponding lower degree of correlation implies that, while height is generally speaking a good predictor, there clearly are factors other than the height at play. When the correlation of two measures is less than perfect, we must watch out for the effects of regression to the mean.
Kahneman observed a general rule: Whenever the correlation between two scores is imperfect, there will be regression to the mean.
This at first might seem confusing and not very intuitive, but the degree of regression to the mean is directly related to the degree of correlation of the variables. This effect can be illustrated with a simple example.
Assume you are at a party and ask why it is that highly intelligent women tend to marry men who are less intelligent than they are. Most people, even those with some training in statistics, will quickly jump in with a variety of causal explanations ranging from avoidance of competition to the fears of loneliness that these females face. A topic of such controversy is likely to stir up a great debate.
Now, what if we asked why the correlation between the intelligence scores of spouses is less than perfect? This question is hardly as interesting and there is little to guess – we all know this to be true. The paradox lies in the fact that the two questions happen to be algebraically equivalent. Kahneman explains:
[…] If the correlation between the intelligence of spouses is less than perfect (and if men and women on average do not differ in intelligence), then it is a mathematical inevitability that highly intelligent women will be married to husbands who are on average less intelligent than they are (and vice versa, of course). The observed regression to the mean cannot be more interesting or more explainable than the imperfect correlation.
Assuming that correlation is imperfect, the chances of two partners representing the top 1% in terms of any characteristic is far smaller than one partner representing the top 1% and the other – the bottom 99%.
The Cause, Effect, and Treatment
We should be especially wary of the regression to the mean phenomenon when trying to establish causality between two factors. Whenever correlation is imperfect, the best will always appear to get worse and the worst will appear to get better over time, regardless of any additional treatment. This is something that the general media and sometimes even trained scientists fail to recognize.
Consider the example Kahneman gives:
Depressed children treated with an energy drink improve significantly over a three-month period. I made up this newspaper headline, but the fact it reports is true: if you treated a group of depressed children for some time with an energy drink, they would show a clinically significant improvement. It is also the case that depressed children who spend some time standing on their head or hug a cat for twenty minutes a day will also show improvement.
Whenever coming across such headlines it is very tempting to jump to the conclusion that energy drinks, standing on the head or hugging cats are all perfectly viable cures for depression. These cases, however, once again embody the regression to the mean:
Depressed children are an extreme group, they are more depressed than most other children—and extreme groups regress to the mean over time. The correlation between depression scores on successive occasions of testing is less than perfect, so there will be regression to the mean: depressed children will get somewhat better over time even if they hug no cats and drink no Red Bull.
We often mistakenly attribute a specific policy or treatment as the cause of an effect, when the change in the extreme groups would have happened anyway. This presents a fundamental problem: how can we know if the effects are real or simply due to variability?
Luckily there is a way to tell between a real improvement and regression to the mean. That is the introduction of the so-called control group, which is expected to improve by regression alone. The aim of the research is to determine whether the treated group improve more than regression can explain.
In real life situations with the performance of specific individuals or teams, where the only real benchmark is the past performance and no control group can be introduced, the effects of regression can be difficult if not impossible to disentangle. We can compare against industry average, peers in the cohort group or historical rates of improvement, but none of these are perfect measures.
***
Luckily awareness of the regression to the mean phenomenon itself is already a great first step towards a more careful approach to understanding luck and performance.
If there is anything to be learned from the regression to the mean it is the importance of track records rather than relying on one-time success stories. I hope that the next time you come across an extreme quality in part governed by chance you will realize that the effects are likely to regress over time and will adjust your expectations accordingly.
What to Read Next
- Upgrade your thinking with 113 mental models explained.
- Read about Second Level Thinking so you can avoid negative consequences.