There are many ways in which you can visualize the concept of equilibrium, but one of the simplest comes from Boombustology where a ball sits on a simple curved shape.
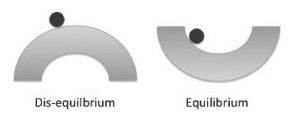
A situation in which equilibrium is possible is one in which over time, if left to its own devices, the ball will find one unique location. Overshooting and undershooting this unique location is self-correcting. A situation of disequilibrium, however, is one in which the ball is unable to find a unique location. A ball in such a state does not generate self-correcting moves that dampen its moves toward a theoretical “equilibrium” or resting spot; rather, disequilibrium generates motion that is self-reinforcing and accelerates the ball’s move away from any stable state.
Let’s take a step back and thank Netwon.
In Principia, he describes his three laws of motion. Using planets, these laws allowed Newton to demonstrate how gravitational forces act between two bodies. He showed that the force of the sun’s gravity (pulling planets toward the sun) is offset by their forward velocity. These two forces, equal in nature, create a state of equilibrium.
Equilibrium is a balance between one or more opposing forces. As you can imagine, different types of equilibrium exist. Static equilibrium is when a system is at rest. Dynamic equilibrium is when two or more forces are equally matched. Robert Hagstorm, in the Last Liberal Art, helps illustrate the difference between the two:
A scale that is equally weighted on both sides is an example of static equilibrium. Fill a bathtub full of water and then turn off the faucet and you will observe static equilibrium. But if you unplug the drain and then turn on the faucet so the level of the bathtub does not change, you are witnessing dynamic equilibrium. Another example is the human body. It remains in dynamic equilibrium so long as the heat loss from cooling remains in balance with the consumption of sugars.
Supply and Demand + Equilibrium
The rule of supply and demand, from economics, is also an example of the law of equilibrium.
In 1997 Warren Buffett, through his company Berkshire Hathaway, purchased 11.2 million ounces of silver-based on his understanding of equilibrium. In his annual letter for that year, he succinctly sums up the investment:
In recent years, bullion inventories have fallen materially, and last summer Charlie (Munger) and I concluded that a higher price would be needed to establish equilibrium between supply and demand.
Too little supply and equilibrium is out of balance. Buffett (correctly) bet that the only way to bring the market back into a state of equilibrium was rising prices. Demand, the balancing force to supply, can also result in successful investments.
In his 2011 shareholder letter, Buffett again illustrates the concept of equilibrium through supply and demand.
Today the world’s gold stock is about 170,000 metric tons. If all of this gold were melded together, it would form a cube of about 68 feet per side. (Picture it fitting comfortably within a baseball infield.) At $1,750 per ounce – gold’s price as I write this – its value would be $9.6 trillion. Call this cube pile A. Let’s now create a pile B costing an equal amount. For that, we could buy all U.S. cropland (400 million acres with output of about $200 billion annually), plus 16 Exxon Mobils (the world’s most profitable company, one earning more than $40 billion annually). After these purchases, we would have about $1 trillion left over for walking-around money (no sense feeling strapped after this buying binge). Can you imagine an investor with $9.6 trillion selecting pile A over pile B?
Beyond the staggering valuation given the existing stock of gold, current prices make today’s annual production of gold command about $160 billion. Buyers – whether jewelry and industrial users, frightened individuals, or speculators – must continually absorb this additional supply to merely maintain an equilibrium at present prices.
A century from now the 400 million acres of farmland will have produced staggering amounts of corn, wheat, cotton, and other crops – and will continue to produce that valuable bounty, whatever the currency may be. Exxon Mobil will probably have delivered trillions of dollars in dividends to its owners and will also hold assets worth many more trillions (and, remember, you get 16 Exxons). The 170,000 tons of gold will be unchanged in size and still incapable of producing anything. You can fondle the cube, but it will not respond.
Admittedly, when people a century from now are fearful, it’s likely many will still rush to gold. I’m confident, however, that the $9.6 trillion current valuation of pile A will compound over the century at a rate far inferior to that achieved by pile B.
In Boombustology, Mansharamani writes:
Inherent in most equilibrium-oriented approaches is a belief that higher prices generate new supply that tends to push prices down. Likewise, it is believed that lower prices generate new demand that tends to push prices up. In this way, deviations from an appropriate price level are self-correcting.
A grasp of supply and demand can help us make better investment decisions. The producers of undifferentiated goods, (e.g., an aluminium can), are (usually) poor investments because the only way they will make adequate returns is under conditions of tight supply. If any excess capacity exists in the industry, prices will trend down towards the cost of producing. In this case, owners are left with unsatisfactory returns on their investment.
The only real winners are the low cost producers. As prices trend down only they can maintain full production whereas high cost competitors must cut production, which starts reducing supply and moves the industry towards equilibrium. When business picks up again, as it inevitably does, the production that was once shuttled comes back online. Only low-cost producers can operate throughout the cycle. Opportunities to profit from equilibrium exist when demand outstrips capacity, which usually results from (1) a positive change in demand or (2) a negative change in supply.
While seductively simple, this model of equilibrium in financial markets is somewhat incomplete. We must consider reflexivity.
George Soros writes, “Reflexivity is, in effect, a two-way feedback mechanism in which reality helps shape the participants’ thinking and the participants’ thinking helps shape reality in an unending process in which thinking and reality may come to approach each other but can never become identical.”
The implications of reflexivity on financial markets are quite profound, particularly with regard to the existence of an equilibrium price. Soros describes these implications in his own words succinctly:
Instead of a tendency towards some kind of theoretical equilibrium, the participants’ views and actual state of affairs enter into a process of dynamic disequilibrium, which may be self-reinforcing at first, moving both thinking and reality in a certain direction, but is bound to become unsustainable in the long run and engender a move in the opposite direction.
Soros’ testimony in 1994 to the House Banking Committee summarizes his theory of reflexivity and how it manifests itself in financial markets:
I must state at the outset that I am in fundamental disagreement with the prevailing wisdom. The generally accepted theory is that markets tend towards equilibrium and on the whole discount the future correctly. I operate using a different theory, according to which financial markets cannot possibly discount the future correctly because they do not merely discount the future, they help to shape it. In certain circumstances, financial markets can affect the so-called fundamentals which they are supposed to reflect. When that happens, markets enter into a state of dynamic disequilibrium and behave quite differently than what would be considered normal by the theory of efficient markets. Such boom/bust sequences do not arise very often, but when they do, they can be very disruptive, precisely because they affect the fundamentals of the economy.
In Boombustology, Mansharamani writes:
… financial extremes are characterized by two primary components: a prevailing trend that exists in reality and a misconception relating to it. He often uses real estate as an example to illustrate this point. The prevailing trend in reality is that there is an increased willingness to lend and a corresponding rise in prices. The misconception relating to this trend is that the prices of real estate are independent of the willingness to lend. Further, as more banks become willing to lend, and the number of buyers therefore rises, the prices of real estate rise—thereby making the banks feel more secure (given higher collateral values) and driving more lending.
Feedback Loops and Equilibrium
In Universal Principles of Design, William Lidwell & co. write:
Every action creates an equal and opposite reaction. When reactions loop back to affect themselves, a feedback loop is created. All real-world systems are composed of many such interacting feedback loops — animals, machines, businesses, and ecosystems, to name a few. There are two types of feedback loops: positive and negative. Positive feedback amplifies system output, resulting in growth or decline. Negative feedback dampers output, stabilizes the system around an equilibrium point.
Positive feedback loops are effective for creating change, but generally result in negative consequences if not moderated by negative feedback loops. For example, in response to head and neck injuries in football in the late 1950s, designers created plastic football helmets with internal padding to replace leather helmets. The helmets provided more protection, but induced players to take increasingly greater risks when tackling. More head and neck injuries occurred (after the introduction of plastic helmets) than before. By concentrating on the problem in isolation (e.g., not considering changes in player behavior designers inadvertently created a positive feedback loop in which players used their head and neck in increasingly risky ways. This resulted in more injuries which resulted in additional redesigns that made the helmet shells harder and more padded and so on.
Negative feedback loops are effective for resisting change. For example, the Segway Human Transported uses negative feedback lops to maintain equilibrium. As a rider leans forward or backward, the Segway accelerates or decelerates to keep the system in equilibrium. To achieve this smoothly, the Segway makes hundreds of adjustments every second. Given the high adjustment rate, the oscillations around the point of equilibrium are so small as to not be detectable. However, if fewer adjustments were made per second, the oscillations would increase in size and the ride would become increasingly jerky.
Diseases and Equilibrium
Malcolm Gladwell illustrates this in The Tipping Point with a hypothetical outbreak of the flu.
Suppose, for example, that one summer 1,000 tourists come to Manhattan from Canada carrying an untreatable strain of twenty-four-hour virus. This strain of flu has a 2 percent infection rate, which is to say that one out of every 50 people who come into close contact with someone carrying it catches the bug himself. Let’s say that 50 is also exactly the number of people the average Manhattanite — in the course of riding the subways and mingling with colleagues at work — comes into contact with every day. What we have, then, is a disease in equilibrium. Those 1,000 Canadian tourists pass on the virus to 1,000 new people on the day they arrive. And the next day those 1,000 newly infected people pass on the virus to another 1,000 people, just as the original 1,000 tourists who started the epidemic are returning to health. With those getting sick and those getting well so perfectly in balance, the flu chugs along at a steady but unspectacular clip through the test of summer and fall.
But then comes the Christmas season. The subways and buses get more crowded with tourists and shoppers, and instead of running into an even 50 people a day, the average Manhattanite now has close contact with, say, 55 people a day. All of a sudden, the equilibrium is disrupted. The 1,000 flu carriers now run into 55,000 people a day and at a 2 percent infection rate, that translates into 1,100 cases the following day. Those 1,100, in turn, are now passing on their virus to 55,000 people as well, so that by day three there are 1,210 Manhattanites with the flu and by day four 1,331 and by the end of the week there are nearly 2,000, and so on up, in an exponential spiral until Manhattan has a full-blow flu epidemic on its hands by Christmas Day. That moment when the average flu carrier went from running into 50 people a day to running into 55 was the Tipping point. It was the point at which an ordinary and stable phenomenon — a low-level flu outbreak — turned into a public health crisis. If you were to draw a graph of the progress of the Canadian flu epidemic, the Tipping point would be the point on the graph where is suddenly turned upward.
The Equilibrium is a part of the Farnam Street latticework of Mental Models.